 |
| English: simulated Wal-Mart logo (Photo credit: Wikipedia) |
New York, Aug.27, stock advice .- You may have come across this headline from a mainstream media outlet last Wednesday:
"Staples Plunges in One of Its Worst Sessions Ever"
The article pointed out how Wednesday's single-day plunge of 15% was one of the worst single-day losses Staples (Nasdaq: SPLS) has ever suffered... Second only to... drumroll, please... Aug. 15, 2012, when it fell 14.6%.
What struck me as odd (and bordering on lazy) was that the writer of this article - as well as the doomsaying commenters on the same article - failed to connect the dots. Think about it. The same company suffered near-15% one-day drops a year apart, almost to the day.
Instead, the writer wasted readers' time lamenting that retailers are reporting lackluster second quarter results as the consumer remains cautious. Yawn...
What I'm about to show you is that these two significant one-day drops (which both just so happened to occur on the day of the company's second quarter earnings release) are no coincidence. And once you understand what's happening, you can greatly improve your investing results - while substantially cutting your risk.
Here's what I mean...
Do You See a Pattern?
I'm just tossing this out there: Maybe Staples' second quarter results are consistently terrible. Maybe, you shouldn't buy Staples shares before its second quarter earnings release...
Let's take a look at Staples' quarterly revenue results:
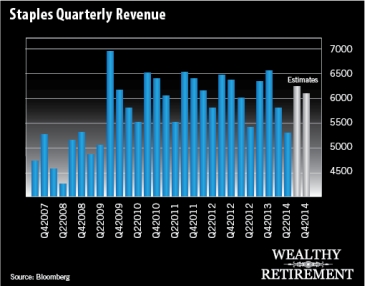
What should be jumping out at you is that the second quarter for Staples is consistently its worst quarter... The only year it wasn't was in 2009, when the first quarter was the bottom.
We also see that the third and fourth quarters are consistently its strongest of the year.
That means the guy who wrote "Staples Plunges in One of Its Worst Sessions Ever" had the opportunity to tell investors that this is a frequent occurrence for the quarter... But he didn't.
Who's Buying in Summer? No One...
Now, let's look at the entire retail sector as a whole. There are plenty of headlines speculating on doom-and-gloom for the industry as second quarter results were largely lackluster.
In the following chart you'll see my Prime System Retail Index, which I use in Emerging Trends Trader. This index is made up of 21 companies. These include teen apparel retailers, big-box discount stores - such as Target (NYSE: TGT), Wal-Mart (NYSE: WMT) and Costco (Nasdaq: COST) - as well as mall-based chains and retail advertisers.
Here is how the Prime System Retail Index has performed from May to October since 2000 to today:

That's a lot of red isn't it?
In 14 years, there have been only five years of gains from May to October - during which the retail industry reports second quarter results. And 2003 and 2009 - the best years during this mid-year stretch - were both rebound years after market collapses.
So, you have to ask yourself: Is this year any different? Are shares of retailers acting outside of this normal seasonal pattern?
Currently, the Prime System Retail Index is down 3.99% since the start of May. The average return for this index from May to October over the last 14 years is -3.73%.
On average, eight companies in the Prime System Index will see a positive gain during the stretch from May to October...
And right now, there are exactly eight companies in the green.
Both figures are in line with the long-term average of the Prime System Retail Index.
That means what's unfolding right now is nothing that's out of character for the sector... In fact, this is exactly what we want.
Hello Holidays!
Obviously, the stock market is about buying low and selling high.
There's a pretty good chance if you're buying retail stocks in late spring, or before the second quarter earnings season, you're buying at a high point and are going to have to suffer through the seasonal low points we see for shares.
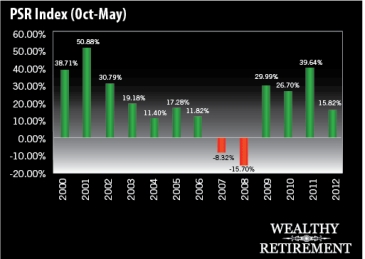
Now let's take a look at that same index and how the companies perform from October to May - the Prime Period for retail stocks (going from their low point to a high point)...
It's a totally different picture, isn't it?
Lots of green... And lots of solid returns year after year.
There were only two years of losses... The rest were all double-digit gains, with six years of gains of 20% or more.
The average return of the Prime System Retail Index from October to May since 2000 has been 20.63%.
On top of that, the average number of companies that have a positive gain during this Prime Period for retailers is 15 - almost double the number of those that see positive gains on average from May to October.
That's a pretty significant trend.
So, now you have to ask yourself: Is this year any different?
Are you going to let the mainstream media fear over retailers make you afraid? Or are you going to start creating a shopping list right now for retail stocks while there is blood in the streets and you know that the best time for the shares are ahead?
.

No comments:
Post a Comment